How to read crypto charts
With the current state of the market, it has proven to be a bit hectic to read crypto charts. This is evidenced by the decimal rise and major fall in the prices of a large number of cryptocurrencies. You possibly have had difficulty interpreting and making a decision due to the market state. In this article, we’ll show you how to read and interpret crypto charts thus making it easier for you to make a decision.
How to interpret candlestick charts.
If you invest in cryptocurrency, you should expect volatility. Volatility refers to the degree of movement in prices. In general, the more volatile the market, such as during times of extreme stress, the greater the potential return. However, there are some exceptions. For instance, Bitcoin tends to be less volatile than other currencies because its supply is limited.

Candlesticks are used in crypto charts. A candlestick is a thick coloured line with thinner lines coming either from the top or from its bottom. Those thinner lines are called either upper shadow or lower shadow, depending on the side they are extending from.
The thicker red or green part shows the opening or closing prices. Candlesticks come in two basic colour styles (white/black or green/red). The green/white candlestick means that the closing price was higher than the opening price while the red/black candlestick indicates the closing price was lower than the opening price.
The upper shadow shows the highest prices while the lower shadow indicates the lowest prices in that candlestick’s time period.
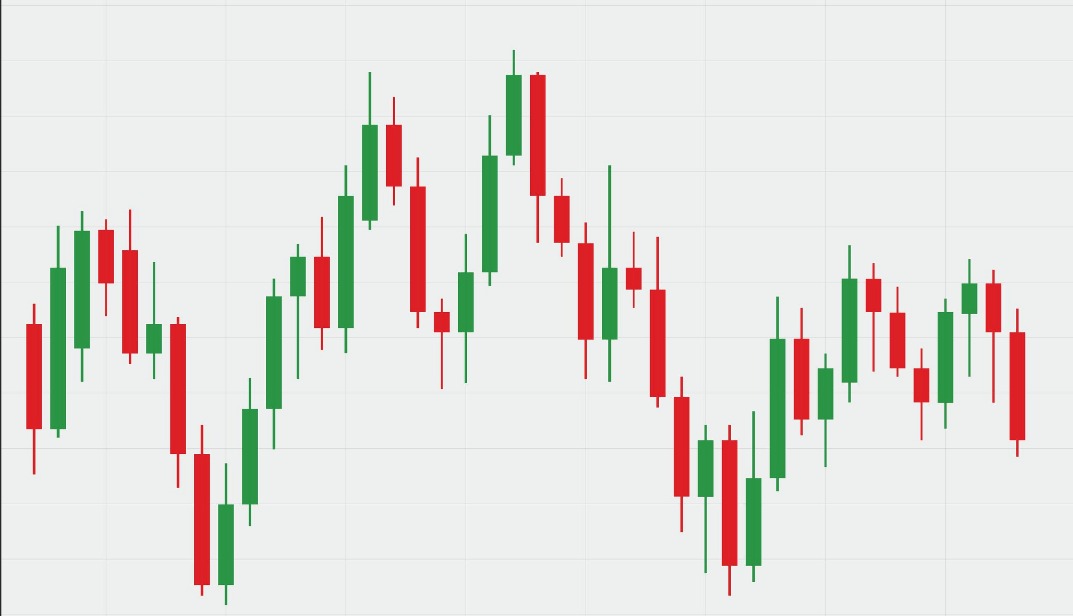
In the above chart, you can see green and red candle sticks. The green candle sticks indicate a rise in the price of bitcoin while the red shows a decline in Bitcoin’s prices.

In the above graph, the highlighted place shows there was a large increase in the price of Bitcoin. In other words, the current price was higher than the opening price and the upper shadow shows the highest price in that candlestick. The red candlestick on the other hand shows that the current price was lower than the opening price. Its lower shadow shows the lowest price that bitcoin reached during that candlestick.
Summary
Candlesticks give you five points of data depending on the time frame you are using:
- The highest price
- The lowest price
- The opening price
- The closing price
- A colour code indicating if the price ended in bullish or bearish
With that knowledge, you can basically try interpreting some candlestick charts first before heading to the real crypto market and investing.
Most exchange programs have live charts which you could study first. If the platform you are using doesn’t you can head over to LiveCharts.co.uk and try interpreting some of the charts there. The platform has both crypto and forex charts therefore you can experiment and predict on either before you decide on entering the market.

